
Centralised logging is a very powerful service. However, because it’s only accessible through Powershell commands, it can be a rather daunting alternative to the old Lync Logging Tool, especially when you’re trying to troubleshoot an issue.
So what can be done about this? Well, Randy Wintle over at the UC Made Easy blog had the great idea of making a GUI interface for the Lync 2013 Preview release, which was based on the ‘ClsController.exe’ command line tool. I like this idea a lot, so now that 2013 is released, I decided to give Randy’s tool a major “Backend Lift” (different than that offered by Kim Kardashian’s plastic surgeon…) and add a bunch of new capabilities.
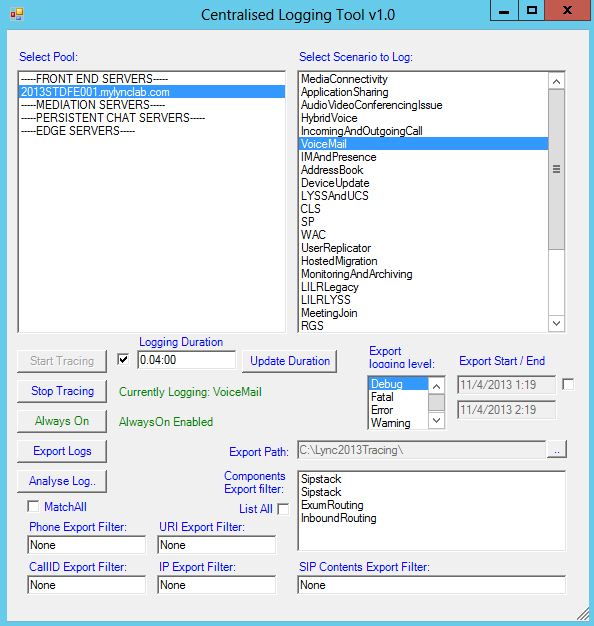
Centralised Logging Tool Features
Centralised Logging Tool features:
- The tool's backend uses Powershell commands, instead of ClsController.exe commands.
- The tool has the ability to manage logging on multiple Pools at once. When the tool first loads it will learn the current state of all the Pools. The UI can show the state of each pool as they are clicked on in the Pools listbox and only allow the user to execute functions that are available in that state (eg. Start and Stop buttons will be disabled if the current state of the pool doesn’t allow you to use them).
- When the tool loads it will query the Lync servers for the status of running logging scenarios, and the tool will display the current state of each pool as it is selected in the pools list. This means that you can use the tool to learn what logging is currently running on each pool.
- The scenarios list is dynamic, so Custom Scenarios will also be included in the scenarios list along with the default scenarios.
- All pool types, including Persistent Chat pools are listed. If Mediation server is co-located with the front end server it will not be added to the list, but if it’s on a separate physical server it will be listed.
- The tool has the ability to have AlwaysOn and Scenario logging enabled at the same time. AlwaysOn logging has its own button and status messages.
- The components filter list can either show all the components available for logging on the system, or list only the components for the specific scenario that is currently being logged (or just logged) on a pool.
- The Logging duration time can be specified when you Start logging, and running scenarios can have their Duration updated with the new Update button. By default, logging will run for 4 hours and then automatically stop. So if you want to do a long running log, or a much shorter log you can specify this when you start logging, or you have the option to Change the duration of a log whilst it’s running. The format of Logging duration is as follows: <days.hours:minutes> (eg. “0.04:00”) .
- You can now select either MatchAll, or MatchAny settings. These settings affect the way multiple filters are applied when Searching/Exporting logs. If MatchAll is used, then the filters execute in a logical ‘AND’ fashion, where all the filters must match to return results. If MatchAny is selected, then the filters apply in a logical ‘OR’, which means if any of the filters match the result will be returned.
- The Call-Id, IP Address, Phone and URI filters have separate text boxes, so these filters can be used in conjunction with each other (and the MatchAll/MatchAny setting) for more precise filtering.
- The Components listbox is Multi-Selectable, offering export filtering by one or many component types at once.
- Start and End time filter is now included as a filter option. By default the Search command will filter through only the last 30 minutes of logs to return a result. If you need to capture more than this then you can used the Start and End time settings. I have made the defaults in these boxes display the range of 1 hour as a starting point. It’s best that you keep the date/time format in the format shown.
- The logging folder can be selected using a Folder Browse dialog to having to type the location.
- Analyse Log button allows you to choose a log file to open directly in Snooper, to save you having to manually open Snooper and import the logs.
- Interface is now written in Australian/British English :)
The Details
The Centralised Logging Tool is Stateful on a per pool basis. By that I mean that it will learn the status of all pools when it loads and it will maintain the state as you Start and Stop services. The process of querying the server (Show-CsClsLogging) for the status of the Centralised Logging Service can take several seconds to execute. This means the Controller has to query all of the Agents and then wait for them to respond before it can report back about the status of the pools. As a result, I tried to minimise the number of times the tool had to re-sync its state with the server. So, it will only request updates on the status of the Agents upon receiving an error response from a command execution (ie. A Start/Stop request). When this happens, it will fully refresh all of the Pools logging status.
I give you the new Centralised Logging Tool UI:
- Fixed the format of the Start/Stop export date format (text fields filled when the script loads) to the region setting of the machine. This was previously hardcoded to Australian format in v1.00. Lync expects the date format in the format of the region of the computer (as set in Control Panel) for the Search command. Thanks to John Crouch for reporting this not working in the US in v1.00.
1.02 Enhancements:
- Added SBA's to the Pool list. They also have the centralised logging service. - Nice pickup by John Crouch.
- Collocated Persistent Chat servers now don't get added to the pool list.
1.03 Enhancements:
- Pools listbox now is in alphabetical order.
- Scenarios listbox is now in alphabetical order.
- Components listbox is now in alphabetical order.
- Annoying counting in Powershell window when the script loads has now been removed.
- Added prerequisite check for Snooper and debugging tools when script loads.
- Script is now signed.
- Using UP and DOWN arrow keys on pools listbox now updates GUI correctly.
- If pool does not have a status then an error ("ERROR: Pool status not found. Check that CLS is running correctly on pool.") will be displayed in the GUI.
- A status message will now display to indicate to select a Pool when no pool is selected in the Pools listbox.
- Fixed error that is displayed when Cancel button on browse dialog is clicked.
- Fixed issue with load files in Snooper that have spaces in them.
1.04 Enhancements:
- Now supports Skype for Business!
- Now checks for Skype for Business Snooper location.
- Changed the default trace saving location to C:\Tracing\
- Now supports Skype for Business 2019. I got requests to release a update for 2019 as an alternative to the existing ClsLogger tool provided by Microsoft. So here it is!
DOWNLOAD HERE
When starting out with the tool you might easily get confused with how the filtering of captures works. As I detailed in my last post about Centralised Logging, logging captures are filtered in the following way:

The scenario filter section shown above will either be a default scenario (capturing only the pre-defined components) that’s are already defined as part of Lync 2013, or you can build your own custom scenarios that log only the components that you are interested in.
The Agent Search filter shown above allows you to run post-capture filters on the data, so you only end up with the log information you want. This is done in the Centralised Logging Tool using the Export filters, and the Export button.
The Centralised Logging Tool has these two sections broken up as follows:

This basically means that the settings outlined in red work in conjunction with the Export button, and the Scenario list works in conjunction with the Start tracing button.

This basically means that the settings outlined in red work in conjunction with the Export button, and the Scenario list works in conjunction with the Start tracing button.
Export Filters
The export filters function as detailed below:
Start and End Times:The Start and End filter will export only items logged between the times specified.
Components Filter:Component filter can be used to select one or more components and the CLS service will export only logs relating to the components specified.
Logging Level: Logging level filters will return all levels up to the level you select; for example ‘Warning’ will retrieve Fatal, Error, and Warning results. The hierarchy is:
- Fatal
- Error
- Warning
- Info
- Verbose
- Debug
- All
URI Filter: The URI Filter setting works as long as you use a full SIP URI, for example john.woods@domain.com, or sip:john.woods@domain.com
IP Filter: Doesn’t appear to work. Lync returns no results for IP addresses. Last checked on version 5.0.8308.872.
CallID Filter: Enter a SIP CallID and any SIP message that matches that CallID will be captured by the filter. In addition to this; any messages with Trace-Correlation-Id's that match that of the SIP message will also be exported.
Example Filter: a1ffa6a5ef7949079ae4b34e7c67293f
...
To: <sip:holly.hunt@mylynclab.com>;tag=DB120080
Call-ID: a1ffa6a5ef7949079ae4b34e7c67293f
CSeq: 2 SUBSCRIBE
...
Phone Filter:
Example Filter: +61395829999
..
<<<<<<<<<<<<Incoming SipMessage c=[<SipTcpConnection_210F5C0>], 192.168.0.97:5068<-192.168.0.20:43904
INVITE sip:+61395829999@2013ENTFE004.mylynclab.com:5068;user=phone SIP/2.0
FROM: <sip:11300@192.168.0.20:5066;user=phone>;tag=aedb006-a46ce
TO: <sip:+61395829999@2013ENTFE004.mylynclab.com:5068;user=phone>
..
Note:The number doesn’t have to be in E.164 format, it just needs to match the number in the TO or FROM field.
SIP Contents:
Example Filter: rtcp:53115
v=0
o=- 29 1 IN IP4 192.168.0.97
s=session
c=IN IP4 192.168.0.97
b=CT:1000
t=0 0
m=audio 53114 RTP/AVP 8 101 13
c=IN IP4 192.168.0.97
a=rtcp:53115
a=label:Audio
a=sendrecv
a=rtpmap:8 PCMA/8000
a=rtpmap:101 telephone-event/8000
a=fmtp:101 0-16
a=rtpmap:13 CN/8000
Known Issue: Errors when Stopping Logging Service
Whilst testing the tool I’ve had some issues from time to time when calling Stop on a running scenario (both AlwaysOn and other Scenarios). The error received looks like this:
Failed on 1 agents
Agent - 2013ENTFE004.domain.com, Reason - Error code - 20003, Message - Unknown error returned by Wpp native assembly - 1168. Please refer CLS logs for details.
Unfortunately, the CLS log didn’t shine any light on why this is occurring (the logs report the same error as shown above with no additional info). I have made the tool so it’s smart enough to recognise these errors and query the server for the state of the pool again, to re-sync the status of all the pools. I have found that if you wait a few minutes (maybe 5 minutes) and then try to stop the logging scenario again it tends to work (or just keep trying till it does). I should stress that this isn’t a problem with the tool, as the issue happens when using Powershell directly as well. So I assume it’s a bug in the Agent side of the code.
If anyone knows how to avoid this error, let me know!
Notes on 2013 Snooper
Snooper is a tool that was available in Lync 2010, which provides the ability to analyse log files that are generated by the Lync Logging Tool. Snooper 2013 now also provides the ability to analyse Lync Centralised Logging Service log files.
Whilst you can also open these log files in a text editor, Snooper makes reading logs far easier. So, to make life easier I decided to put a button in the Centralised Logging Tool that will launch Snooper directly. Here it is:

When you click this button you will be shown a File Dialog that
Note: If your Snooper tool is in a non-standard location you can edit a global variable in the script to point to whatever location you like:
$script:snooperLocation = "C:\Program Files\Microsoft Lync Server 2013\Debugging Tools\Snooper.exe"
If you want to change the location that the log files are saved to, edit this global variable:
$script:pathDialog = "C:\Lync2013Tracing\"
Some other good news about Snooper for Lync 2013 is that it has some cool new features, one of which is the Call Diagram button:

When you have messages from a SIP dialog selected in Snooper, and press this button, it will launch a diagrammatic representation of that particular SIP Dialog, as shown here:

Note: You have to be on the Messages tab of Snooper to launch the call flow analyser. If you are on the Trace tab you will receive a “This message is not eligible for callflow” error.
Pretty cool, huh!
Wrap Up
I have spent quite a bit of time working on the tool and tweaking it to work for most functions that I can see people wanting to use it for. If I’ve missed something and you have an awesome idea for additional functionality, let me know. Other than that, happy logging!


Hi James,
ReplyDeleteIt seems that the logging tool doesn't seem to work properly in the current Lync environment that I'm working in and it looks like powershell crashes during startup, the error: "WaitAll for multiple handles on a STA thread is not supported." The UI is built, but the start button is always greyed out no matter what pool we select, so it doesn't seem to be getting the status anymore.
This is most likely due to the large amount of Lync pools. Is there a way to change the script in such a way that you can start the script directly pointing to a single pool or do not lookup any status untill one pool is selected?
Thanks in advance,
Hans
Hi Hans, this seems to be a bug in Centralised Logging. The Tool only calls the standard CLS Powershell commands in the background, so it's likely you will see the same issue running the CLS Powershell commands directly as well. Please have a look at this post from Richard Schwendiman where he details a work around for the issue: http://blogs.technet.com/b/rischwen/archive/2014/06/10/resetting-cls-configuration.aspx
Deletethanks so much for this tool! it's SOOO handy. I appreciate your efforts!
ReplyDeleteThis Centralized Logging Tool that you did is awesome.
ReplyDeleteCongratulations for share it to the community.
Wonderful! Gives real good insight in how commands work and which options are needed.
ReplyDeleteThanks very much!